This article is part of a regular series of thought leadership pieces from some of the more influential ETF strategists in the money management industry. Today’s article features Benjamin Lavine, chief investment officer for 3D Asset Management.
A lot has been said about the strong market performance in 2017, but not much has been said about the impact of the wide U.S. sector dispersion on U.S. smart-beta performance.
When most equity strategies return north of 20%, one doesn’t necessarily quibble about dispersion or relative performance amongst like-minded strategies. But it’s important to understand how a smart-beta ETF is constructed and how it fits within the overall portfolio.
Smart-beta ETFs that deliver single-factor exposure—such as value and momentum—will generally deliver similar results to each other, as the underlying factor volatility will drive the overall volatility of the ETF over the long run.
However, differences in basket design and security weightings can produce material short-term dispersion among similar strategies, which further amplifies the importance of understanding how these ETFs fit within your overall portfolio from a risk contribution standpoint.
Low-Volatility Example
In the past, we’ve highlighted key differences within the low-volatility smart-beta ETF category using the iShares MSCI USA Min Vol USA (USMV) and the PowerShares S&P 500 Low Volatility Portfolio (SPLV) as two primary examples.
The former delivers a low-volatility portfolio via risk-based optimization, while the latter delivers a portfolio of low-volatility stocks via ranking and weighting the lowest-volatility stocks within the S&P 500. Over the long run, such differences should smooth out, but they can lead to short-term dispersion.
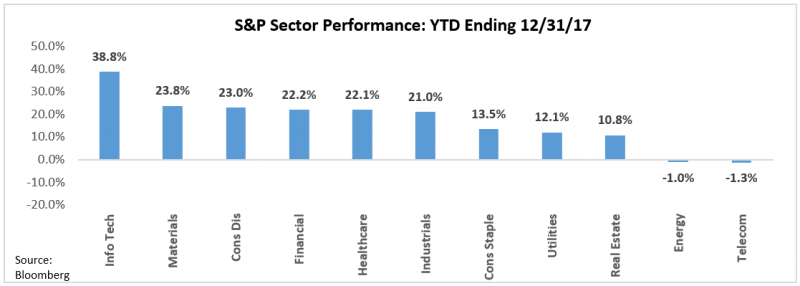
In 2017, technology stocks dominated all the other S&P sectors (Figure 1). Sector positioning around technology can explain a large portion of the outperformance active managers enjoyed last year, especially large value managers versus a market-cap-weighted style benchmark like the Russell 1000 Value Index. This high level of sector dispersion was a main contributor to the dispersion seen among smart-beta ETFs that provide exposures to the same factor theme.
Figure 1: Technology Sector Dominated All Other Sectors In 2017

To Neutralize Or Not To Neutralize Sectors?
In factor construction, one determines whether or not to “neutralize” sector effects. This can be done at the ranking stage, where stocks are ranked within their respective sectors, or at the portfolio construction phase, where sectors are assigned their market-cap weighting; larger sectors receive larger overall weightings.
In 2017, sector neutralization largely determined how your smart-beta ETF performed and whether it delivered the desired factor exposure you were expecting.
A momentum smart-beta ETF that didn’t “sector neutralize” probably performed well above momentum ETFs that incorporated some form of sector neutralization (Figure 2).


